
Topic: Transfer Of Heat Energy
Transfer Of Heat Energy
What caused the interior of Earth to separate into layers?
(1) a decrease in the rate of rotation of Earth
(2) the gravitational pull on materials of varying densities
(3) variations in heating by the Sun due to Earth’s tilt
(4) collisions with meteors and comets
The north polar view maps below show the average area covered by Arctic Sea ice in September of 1980, 2000, and 2011.
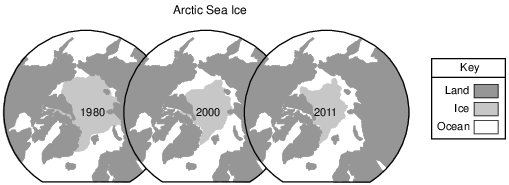
The maps best support the inference that Earth’s climate is
(1) cooling, because the average area covered by Arctic Sea ice is decreasing
(2) cooling, because the average area covered by Arctic Sea ice is increasing
(3) warming, because the average area covered by Arctic Sea ice is decreasing
(4) warming, because the average area covered by Arctic Sea ice is increasing
What is the average air pressure exerted by Earth’s atmosphere at sea level, expressed in millibars and inches of mercury?
(1) 1013.25 mb and 29.92 in of Hg
(2) 29.92 mb and 1013.25 in of Hg
(3) 1012.65 mb and 29.91 in of Hg
(4) 29.91 mb and 1012.65 in of Hg
Which climate condition generally results from both an increase in distance from the equator and an increase in elevation above sea level?
(1) cooler temperatures
(2) warmer prevailing winds
(3) increased precipitation
(4) increased air pressure
A ship is at a location of 40° S 77° W. Which type of surface ocean current and tectonic plate boundary are located beneath this ship?
(1) warm ocean current and a transform boundary
(2) warm ocean current and a convergent boundary
(3) cool ocean current and a transform boundary
(4) cool ocean current and a convergent boundary
The map below shows a cold, arctic air mass that moved southeast from Canada to cover most of the eastern half of the United States during January 2010.
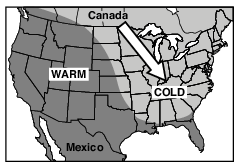
Which shift caused this flow of cold air out of Canada?
(1) the northward shift of the global temperature zones
(2) the northward shift of the Sun’s vertical rays
(3) a southward shift of the polar front jet stream
(4) a southward shift of the subtropical jet stream
What controls the direction of movement of most surface ocean currents?
(1) density differences at various ocean depths
(2) varying salt content in the ocean
(3) prevailing winds
(4) seismic activity
The map below shows two seasonal positions of the polar front jet stream over North America.
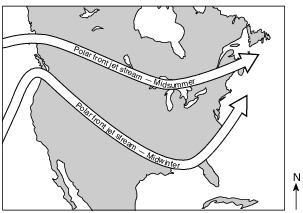
Which statement best explains why the position of the polar front jet stream varies with the seasons?
(1) Rising air compresses and cools in winter.
(2) Water heats and cools more rapidly than land in winter.
(3) Prevailing winds reverse direction in summer.
(4) The vertical rays of the Sun shift north of the equator in summer.
The direction of movement of the major surface ocean currents is most affected by Earth’s
(1) tilted axis
(2) prevailing winds
(3) rate of revolution
(4) tidal action
Which two 23.5°-latitude locations are influenced by cool surface ocean currents?
(1) the east coast of North America and the west coast of Australia
(2) the east coast of Asia and the east coast of North America
(3) the west coast of Africa and the east coast of South America
(4) the west coast of North America and the west coast of South America
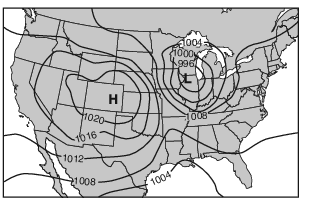
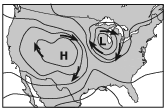
The arrows on which map best show the pattern of surface winds around these two pressure centers?
(1) 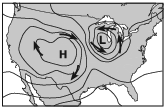
(2) 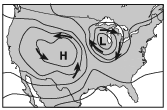
(3) 
(4) 
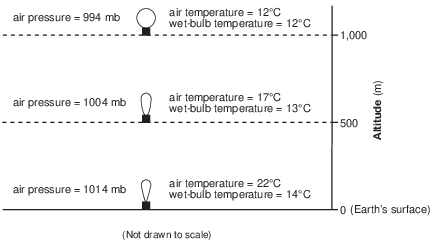
A cloud is forming at 1000 meters. Identify the phase change that is occurring at 1000 meters to produce the cloud. [1]
Allow 1 credit. Acceptable responses include, but are not limited to:
• — condensation
• — water vapor changing to liquid water
• — gas to liquid
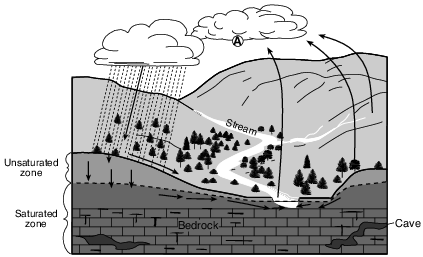
Identify the water cycle process causing cloud formation to occur at location A, and state whether energy is gained or released by the water vapor during this process. [1]
Allow 1 credit if both responses are correct.
• Process:
• — condensation or deposition
• Energy is:
• — released

Describe one ocean surface condition or atmospheric condition that makes the area over the Atlantic Ocean between 10° N latitude and 20° N latitude ideal for these hurricanes to form. [1]
Allow 1 credit. Acceptable responses include, but are not limited to:
• — The warm waters that give the hurricane its energy are located in this tropical region of the
• ocean.
• — Warm ocean waters between 10° N and 20° N fuel hurricanes.
• — Warm and/or humid atmospheric conditions exist between 10° N and 20° N.
• — a maritime tropical air mass
• — low air pressure
• — rising air currents
• — low wind shear
Nor’easters
A nor’easter is a large, low-pressure storm system that moves along the east coast of the United States. The wind over the land blows generally from the northeast as the center of the low passes by a location, hence the name nor’easter. Due to the circulation of winds around the center of the low-pressure system, large amounts of precipitation occur as moist air is carried from the ocean to the land. These storms usually intensify off of the North Carolina coast as they track toward the northeast.
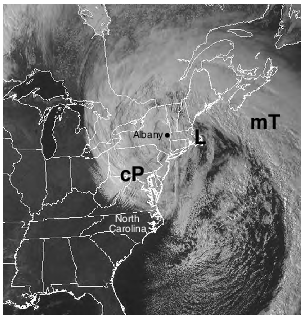
Circle the terms that best describe the relative moisture and relative temperature characteristics of the mT air mass compared to the cP air mass shown on the map. [1]
Relative moisture of mT air mass (circle one): more humid less humid the same Relative temperature of mT air mass (circle one): cooler warmer the same
Allow 1 credit for circling both more humid and warmer.